5 Practical Steps to Build an IoT Data Pipeline in Azure March 2020 Bruno Amaro Almeida @bruno_amaro Saman Ahmadi @samanax
Slide 1
Slide 2

Thank you! Kiitos! Danke! Tack! Hello! Saman Ahmadi PRINCIPAL ARCHITECT & ADVISOR Reach out on: BERLIN • HELSINKI • LONDON • MUNICH • OSLO • STOCKHOLM • STUTTGART • TAMPERE Bruno Amaro Almeida PRINCIPAL ARCHITECT & ADVISOR Reach out on: @samanax @bruno_amaro @samana @brunoamaroalmeida
Slide 3
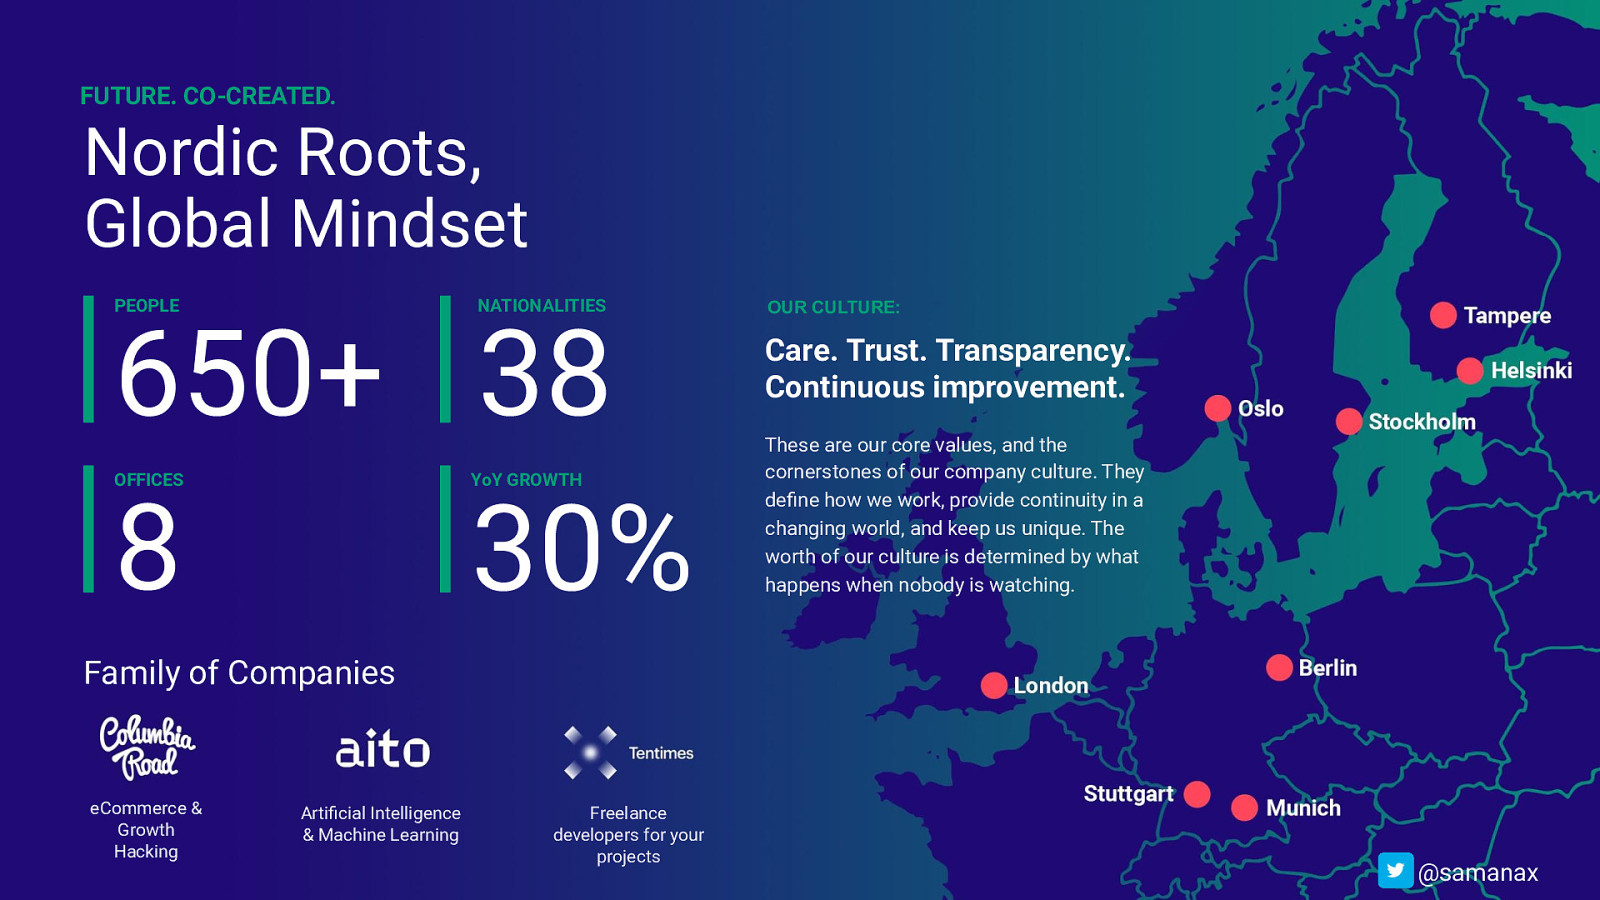
FUTURE. CO-CREATED. Nordic Roots, Global Mindset PEOPLE NATIONALITIES 650+ 38 8 30% OFFICES YoY GROWTH OUR CULTURE: Care. Trust. Transparency. Continuous improvement. These are our core values, and the cornerstones of our company culture. They define how we work, provide continuity in a changing world, and keep us unique. The worth of our culture is determined by what happens when nobody is watching. Family of Companies eCommerce & Growth Hacking Artificial Intelligence & Machine Learning Freelance developers for your projects @samanax
Slide 4
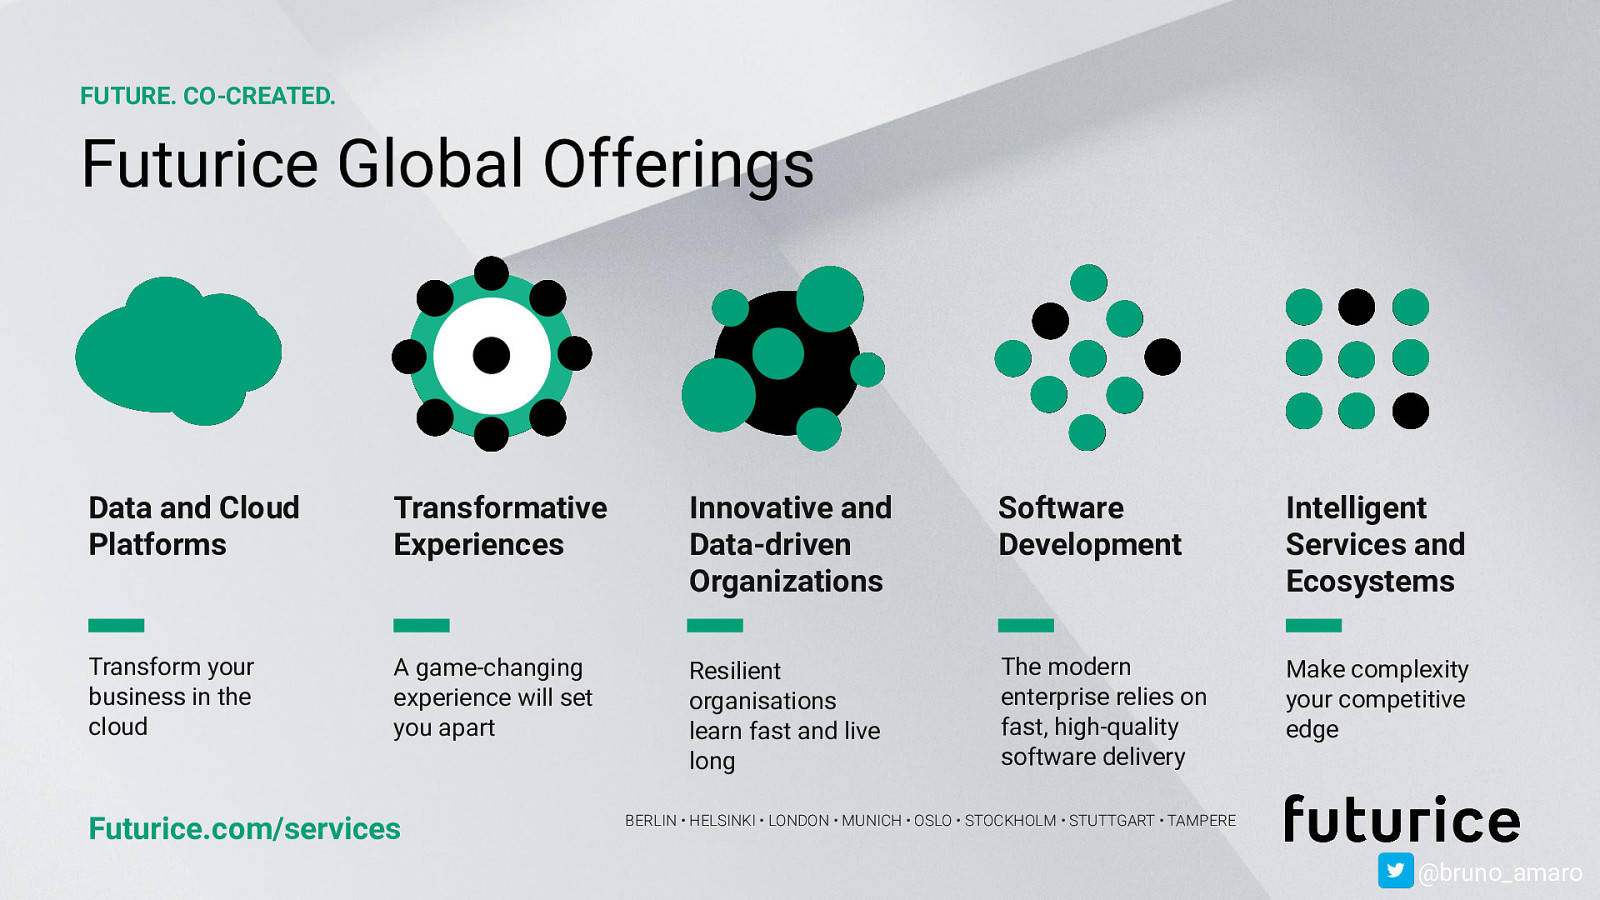
FUTURE. CO-CREATED. Futurice Global Offerings Data and Cloud Platforms Transformative Experiences Innovative and Data-driven Organizations Software Development Intelligent Services and Ecosystems Transform your business in the cloud A game-changing experience will set you apart Resilient organisations learn fast and live long The modern enterprise relies on fast, high-quality software delivery Make complexity your competitive edge Futurice.com/services BERLIN • HELSINKI • LONDON • MUNICH • OSLO • STOCKHOLM • STUTTGART • TAMPERE @bruno_amaro
Slide 5
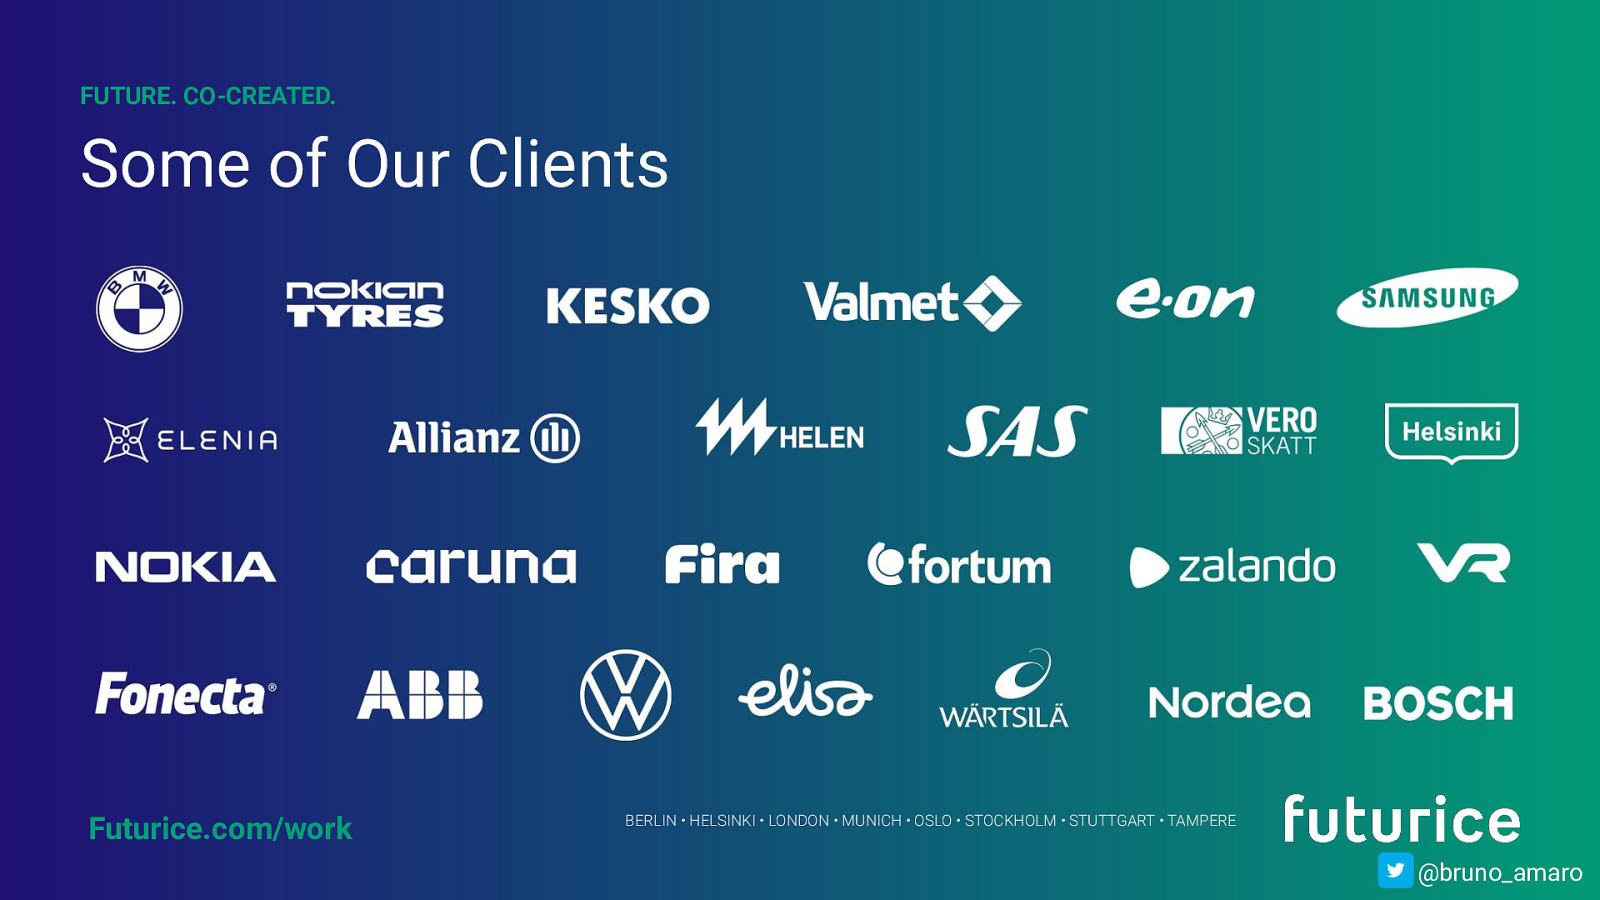
FUTURE. CO-CREATED. Some of Our Clients Futurice.com/work BERLIN • HELSINKI • LONDON • MUNICH • OSLO • STOCKHOLM • STUTTGART • TAMPERE @bruno_amaro
Slide 6
IoT? Data Pipeline? The Internet of Things (IoT) is a network comprised of physical objects capable of gathering and sharing electronic information. source: investiopedia.com @bruno_amaro
Slide 7
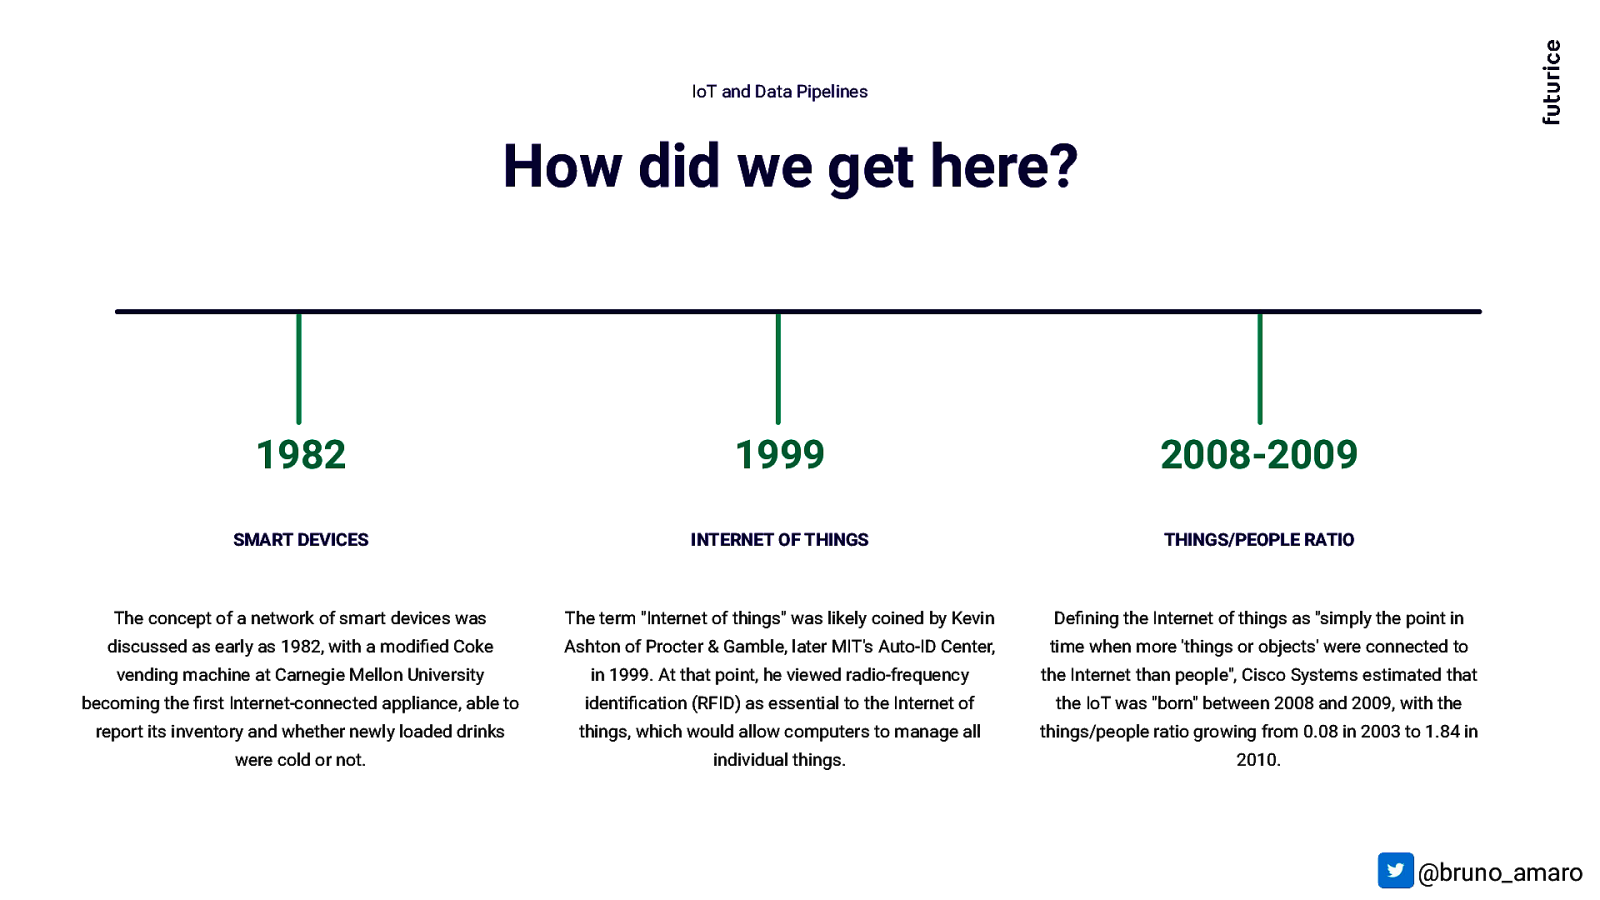
IoT and Data Pipelines How did we get here? 1982 1999 2008-2009 SMART DEVICES INTERNET OF THINGS THINGS/PEOPLE RATIO The concept of a network of smart devices was The term “Internet of things” was likely coined by Kevin Defining the Internet of things as “simply the point in discussed as early as 1982, with a modified Coke Ashton of Procter & Gamble, later MIT’s Auto-ID Center, time when more ‘things or objects’ were connected to vending machine at Carnegie Mellon University in 1999. At that point, he viewed radio-frequency the Internet than people”, Cisco Systems estimated that becoming the first Internet-connected appliance, able to identification (RFID) as essential to the Internet of the IoT was “born” between 2008 and 2009, with the report its inventory and whether newly loaded drinks things, which would allow computers to manage all things/people ratio growing from 0.08 in 2003 to 1.84 in were cold or not. individual things. 2010. @bruno_amaro
Slide 8
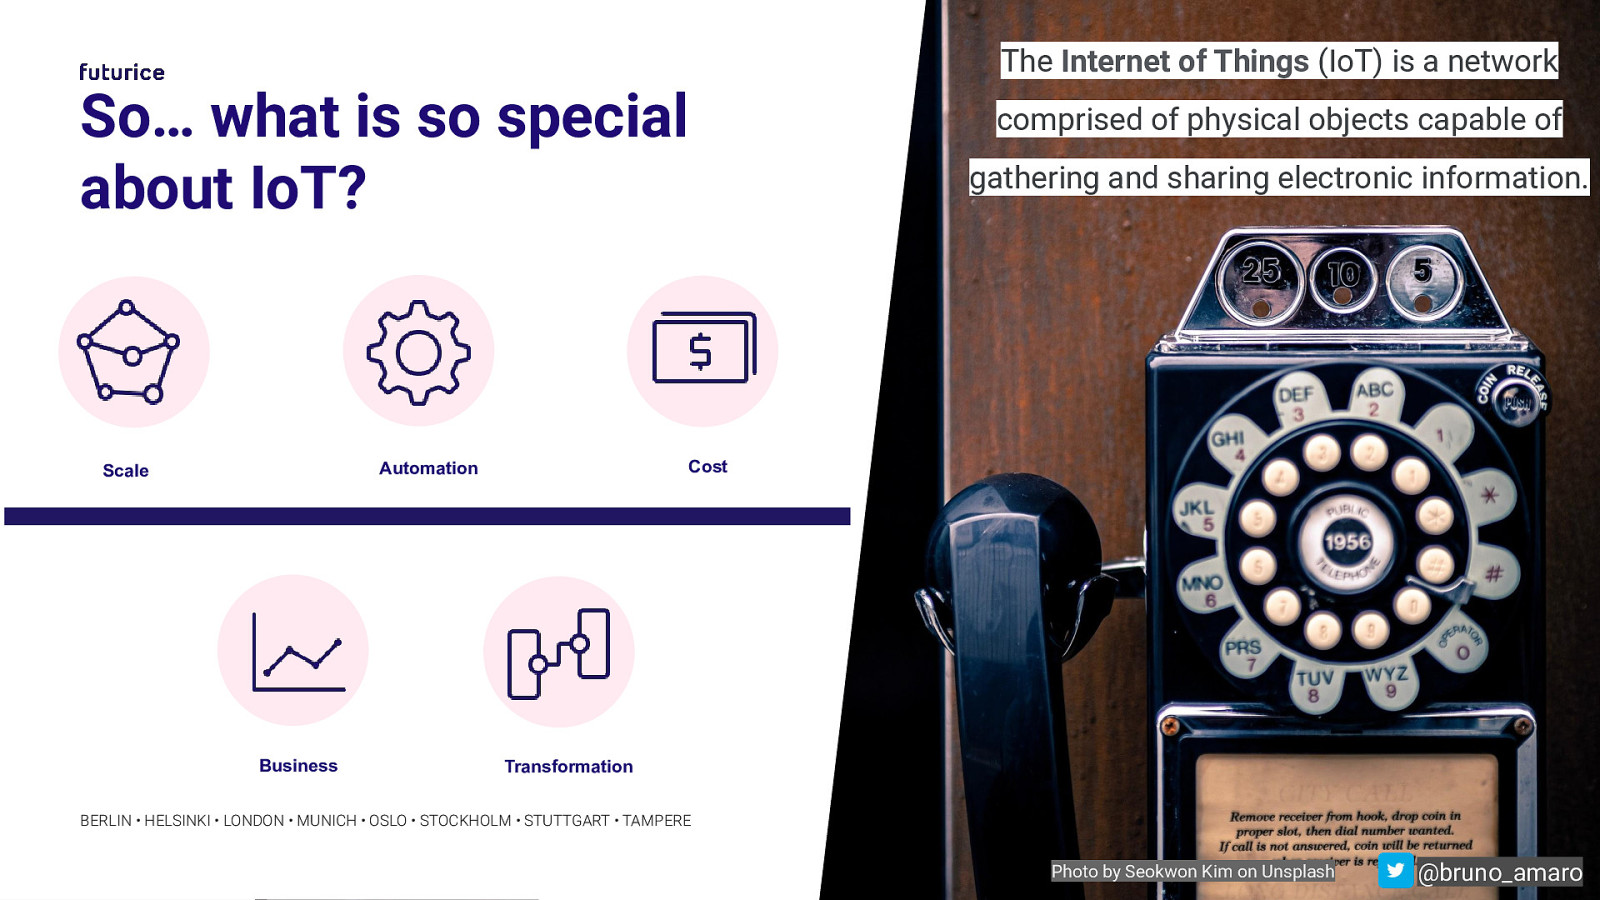
The Internet of Things (IoT) is a network So… what is so special about IoT? Business gathering and sharing electronic information. Cost Automation Scale comprised of physical objects capable of Transformation BERLIN • HELSINKI • LONDON • MUNICH • OSLO • STOCKHOLM • STUTTGART • TAMPERE Photo by Seokwon Kim on Unsplash @bruno_amaro
Slide 9

// 5 Practical Steps Photo by Zan on Unsplash @bruno_amaro
Slide 10
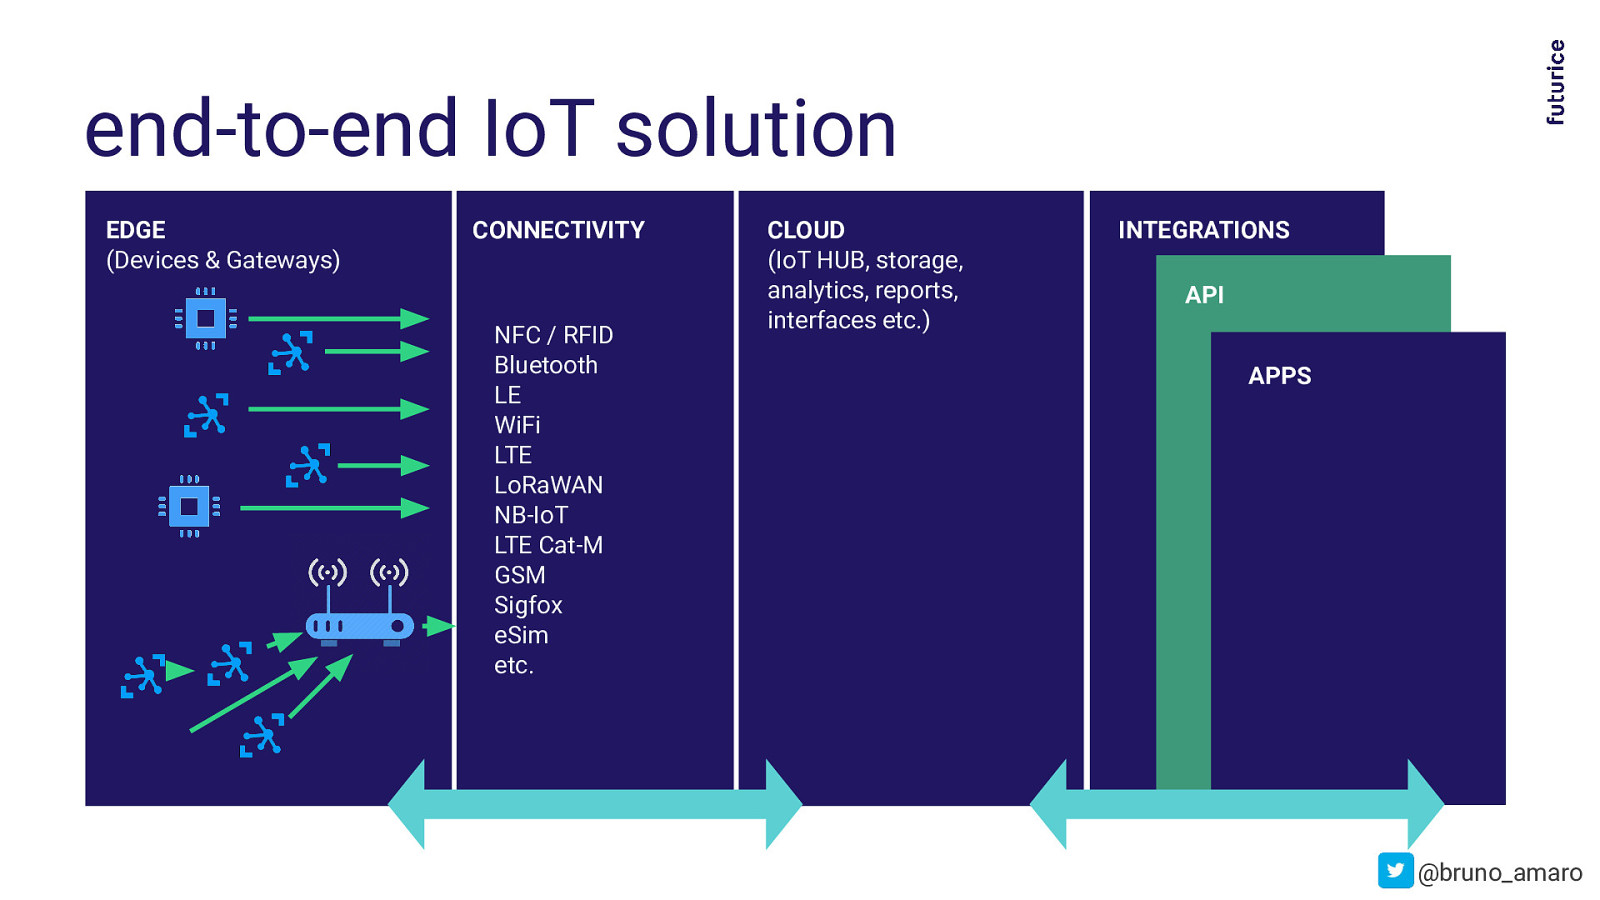
end-to-end IoT solution EDGE (Devices & Gateways) CONNECTIVITY NFC / RFID Bluetooth LE WiFi LTE LoRaWAN NB-IoT LTE Cat-M GSM Sigfox eSim etc. CLOUD (IoT HUB, storage, analytics, reports, interfaces etc.) INTEGRATIONS API APPS @bruno_amaro
Slide 11
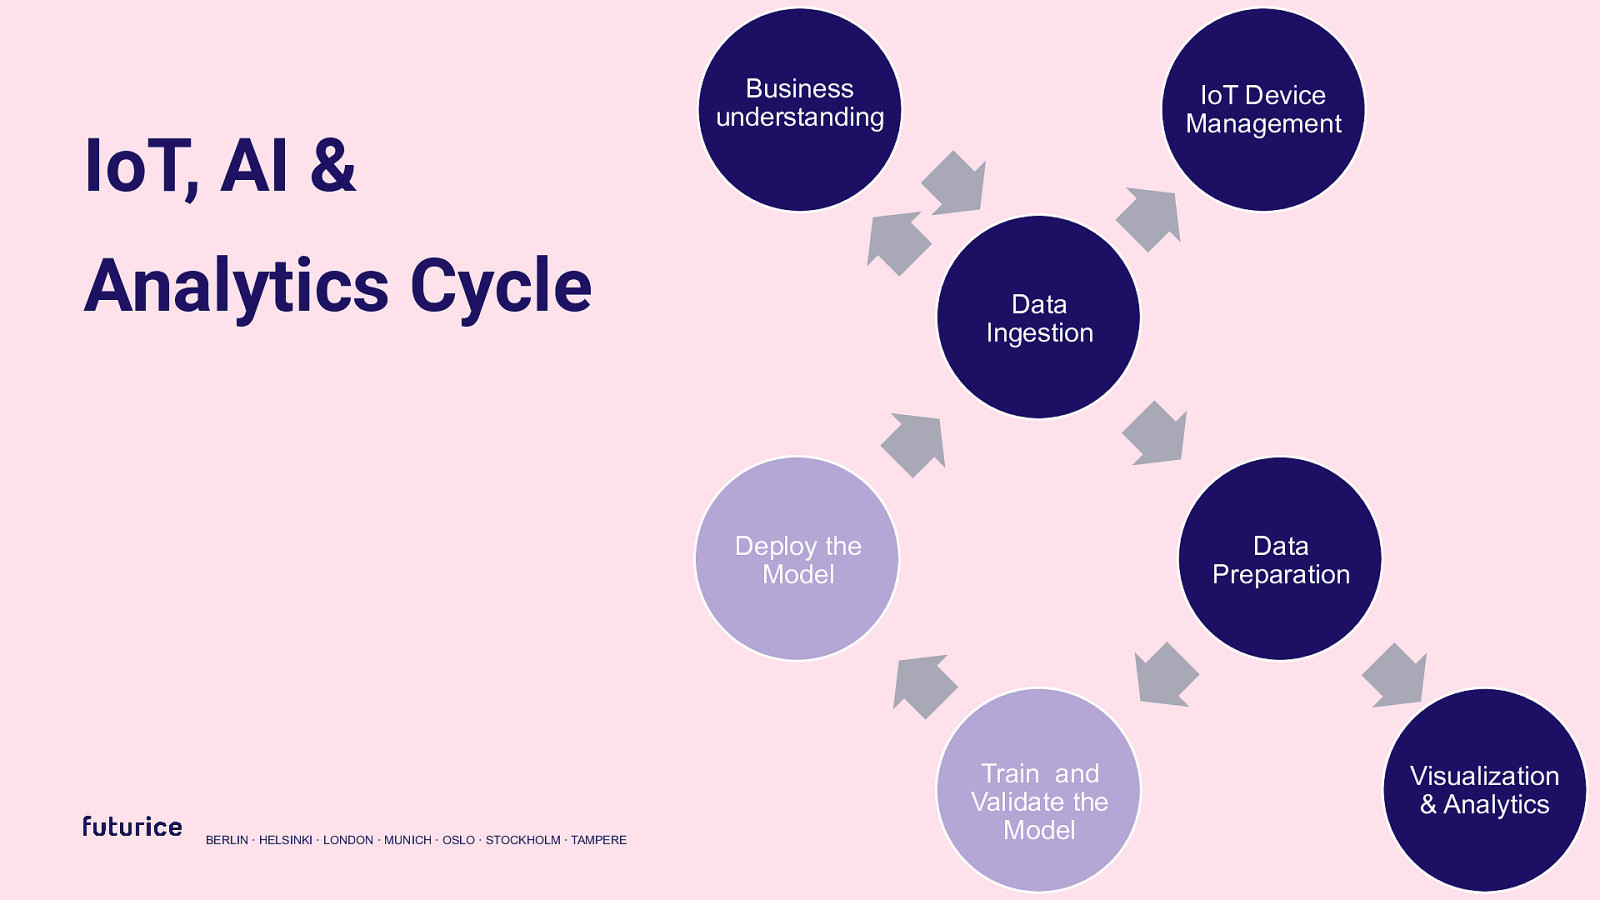
Business understanding IoT Device Management IoT, AI & Analytics Cycle Data Ingestion Deploy the Model BERLIN · HELSINKI · LONDON · MUNICH · OSLO · STOCKHOLM · TAMPERE Data Preparation Train and Validate the Model Visualization & Analytics
Slide 12

- Business Understanding Photo by Adeolu Eletu on Unsplash @samanax
Slide 13
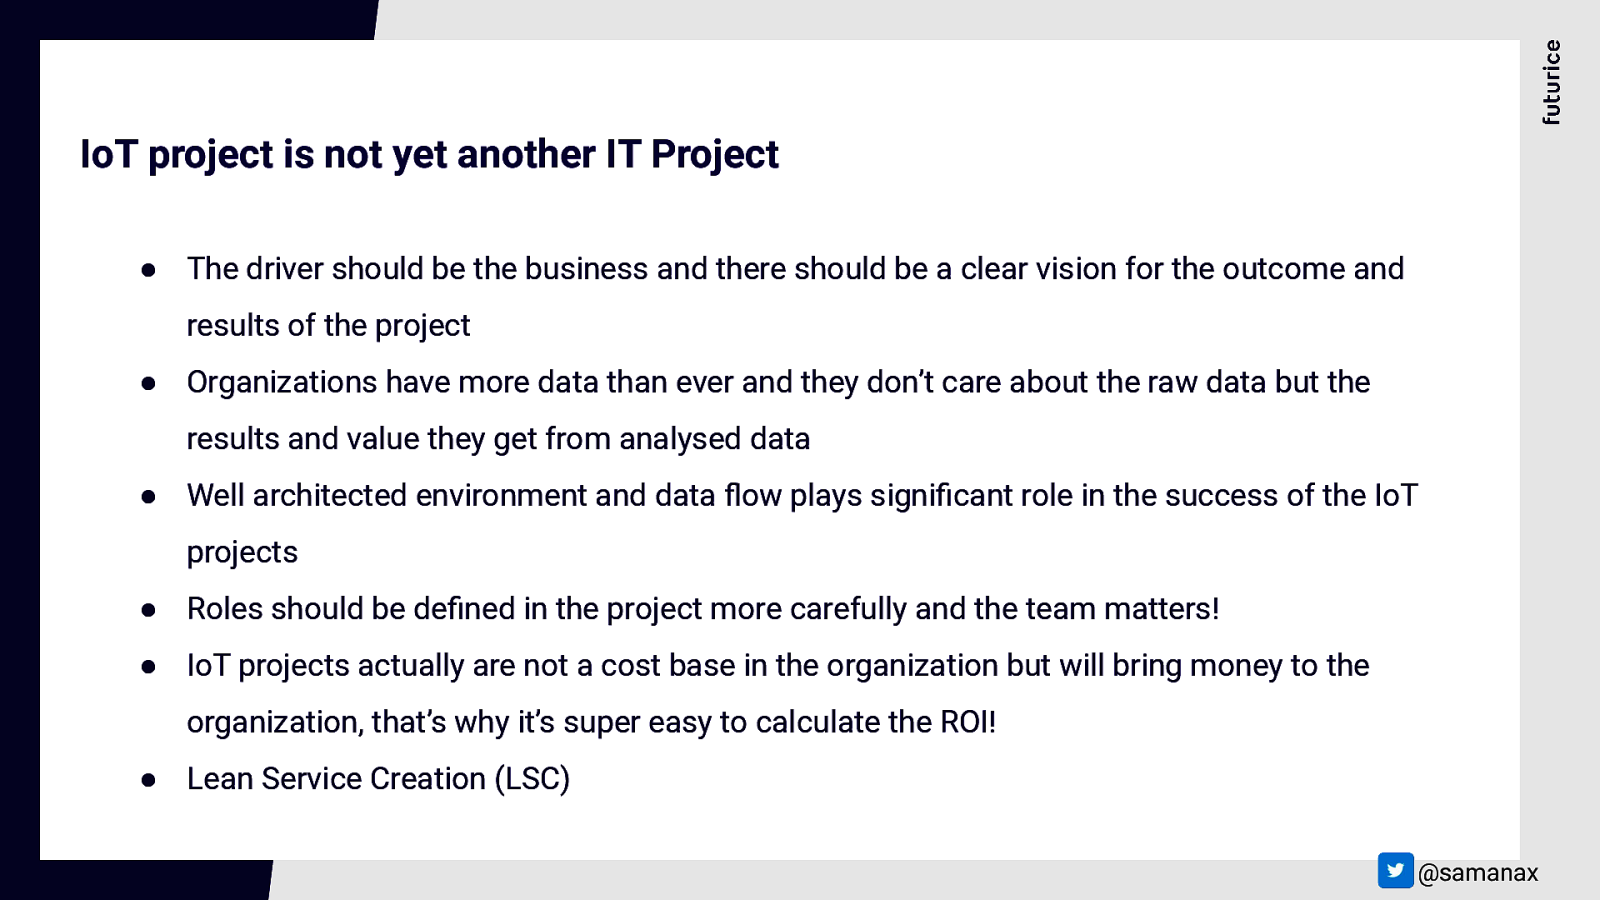
IoT project is not yet another IT Project ● The driver should be the business and there should be a clear vision for the outcome and results of the project ● Organizations have more data than ever and they don’t care about the raw data but the results and value they get from analysed data ● Well architected environment and data flow plays significant role in the success of the IoT projects ● Roles should be defined in the project more carefully and the team matters! ● IoT projects actually are not a cost base in the organization but will bring money to the organization, that’s why it’s super easy to calculate the ROI! ● Lean Service Creation (LSC) @samanax
Slide 14
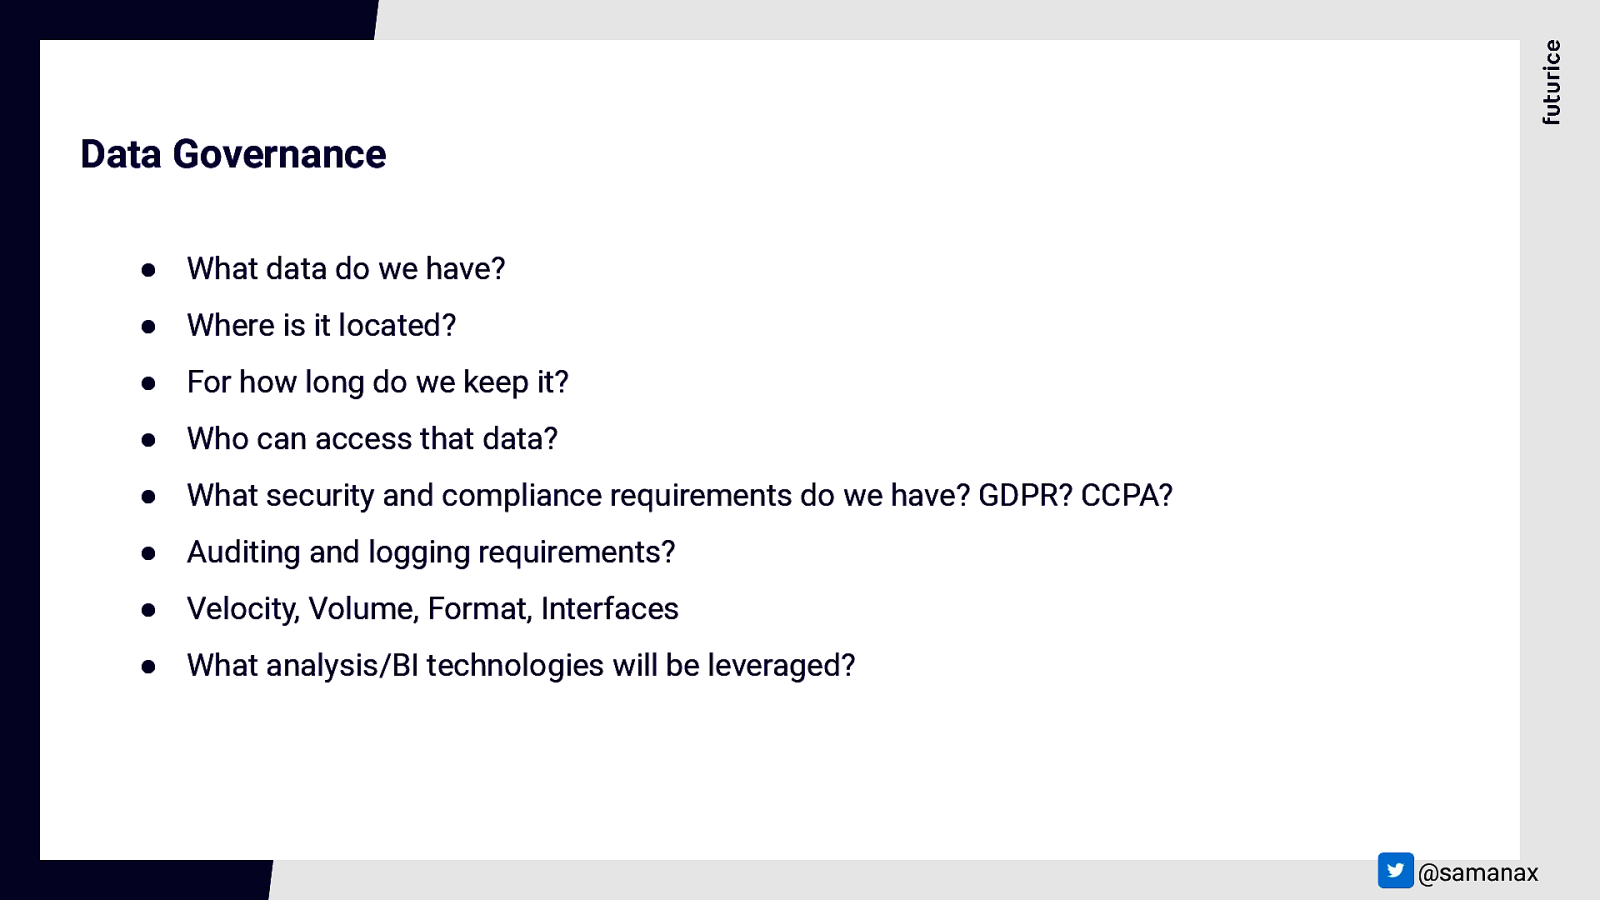
Data Governance ● What data do we have? ● Where is it located? ● For how long do we keep it? ● Who can access that data? ● What security and compliance requirements do we have? GDPR? CCPA? ● Auditing and logging requirements? ● Velocity, Volume, Format, Interfaces ● What analysis/BI technologies will be leveraged? @samanax
Slide 15
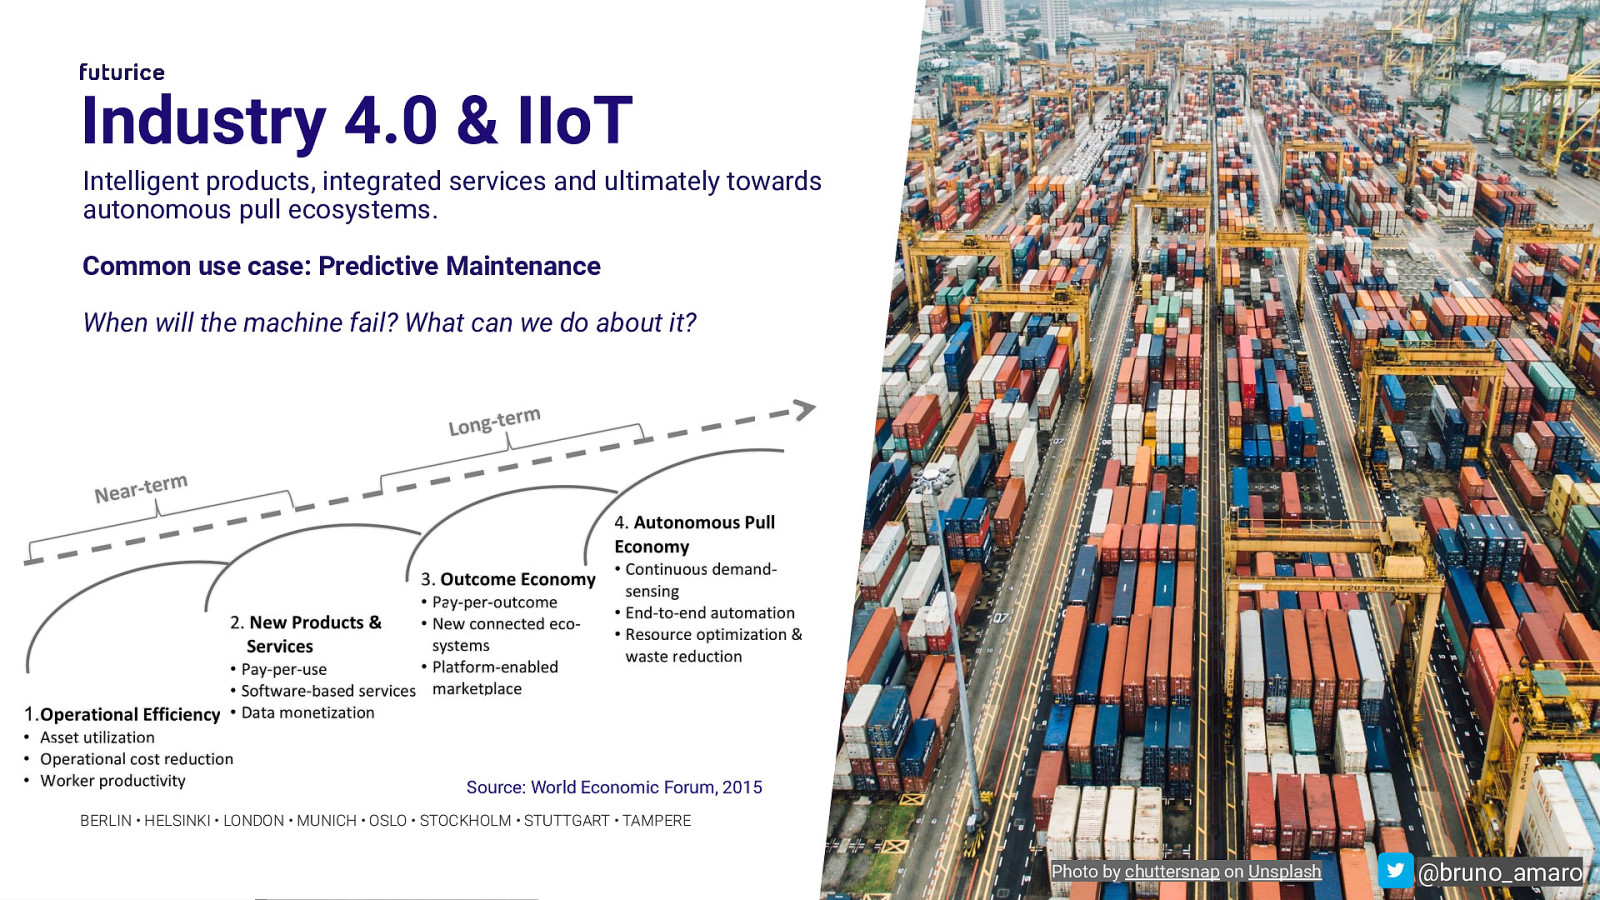
Industry 4.0 & IIoT Intelligent products, integrated services and ultimately towards autonomous pull ecosystems. Common use case: Predictive Maintenance When will the machine fail? What can we do about it? Source: World Economic Forum, 2015 BERLIN • HELSINKI • LONDON • MUNICH • OSLO • STOCKHOLM • STUTTGART • TAMPERE Photo by chuttersnap on Unsplash @bruno_amaro
Slide 16
- IoT Devices & Connectivity Photo by Louis Reed on Unsplash @bruno_amaro
Slide 17
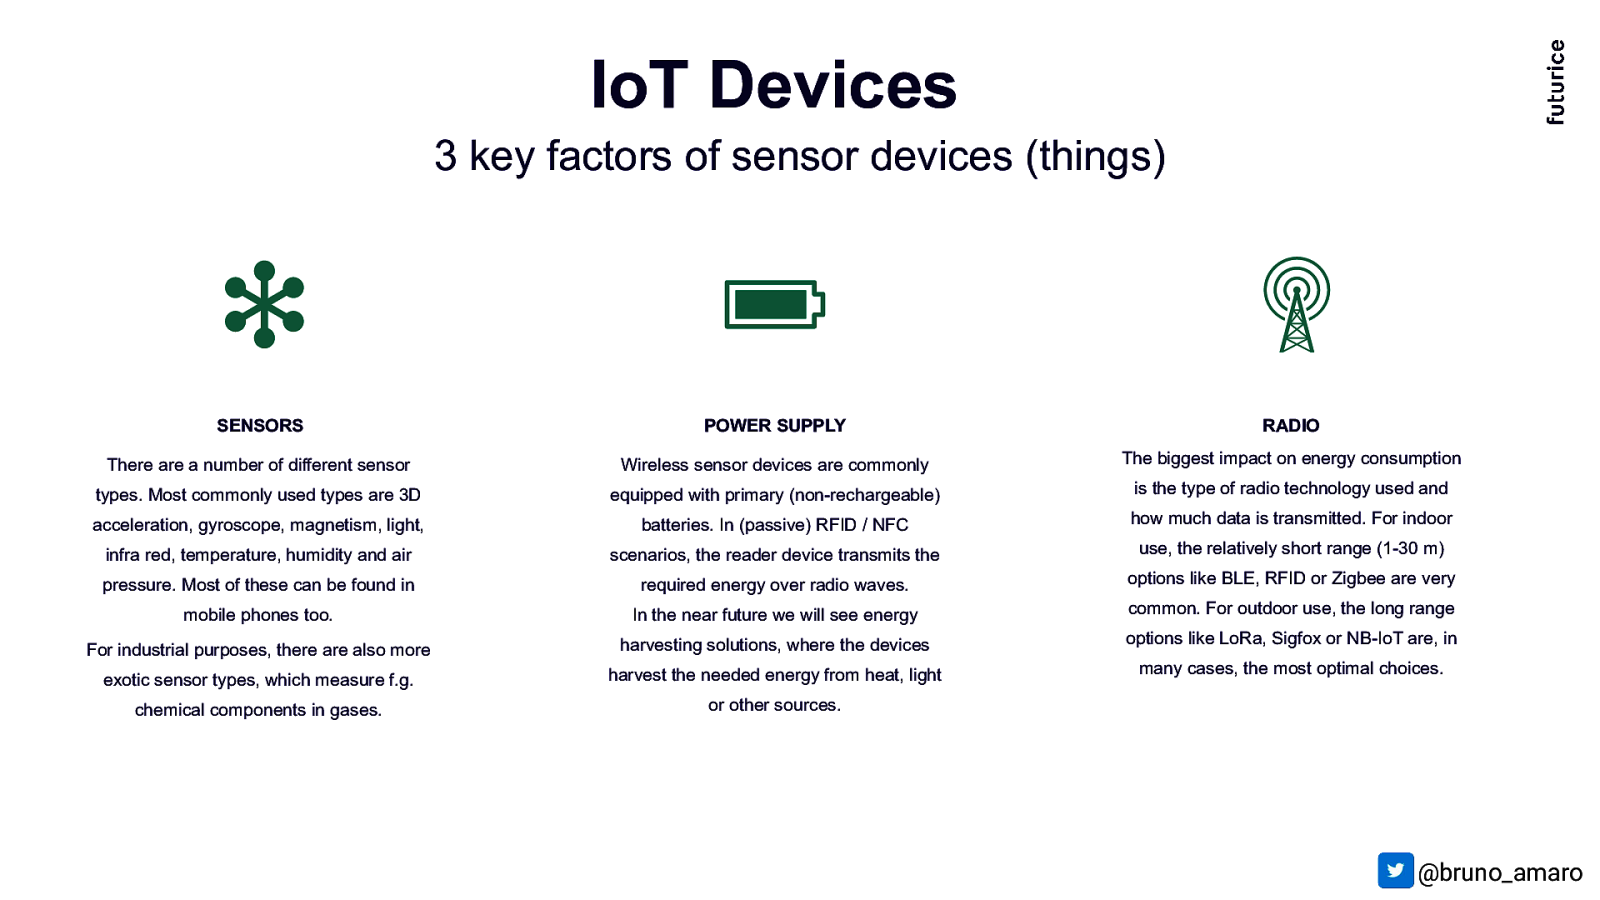
IoT Devices 3 key factors of sensor devices (things) SENSORS POWER SUPPLY RADIO There are a number of different sensor Wireless sensor devices are commonly The biggest impact on energy consumption types. Most commonly used types are 3D equipped with primary (non-rechargeable) is the type of radio technology used and acceleration, gyroscope, magnetism, light, batteries. In (passive) RFID / NFC how much data is transmitted. For indoor infra red, temperature, humidity and air scenarios, the reader device transmits the use, the relatively short range (1-30 m) pressure. Most of these can be found in required energy over radio waves. options like BLE, RFID or Zigbee are very mobile phones too. In the near future we will see energy common. For outdoor use, the long range For industrial purposes, there are also more harvesting solutions, where the devices options like LoRa, Sigfox or NB-IoT are, in exotic sensor types, which measure f.g. harvest the needed energy from heat, light many cases, the most optimal choices. chemical components in gases. or other sources. @bruno_amaro
Slide 18
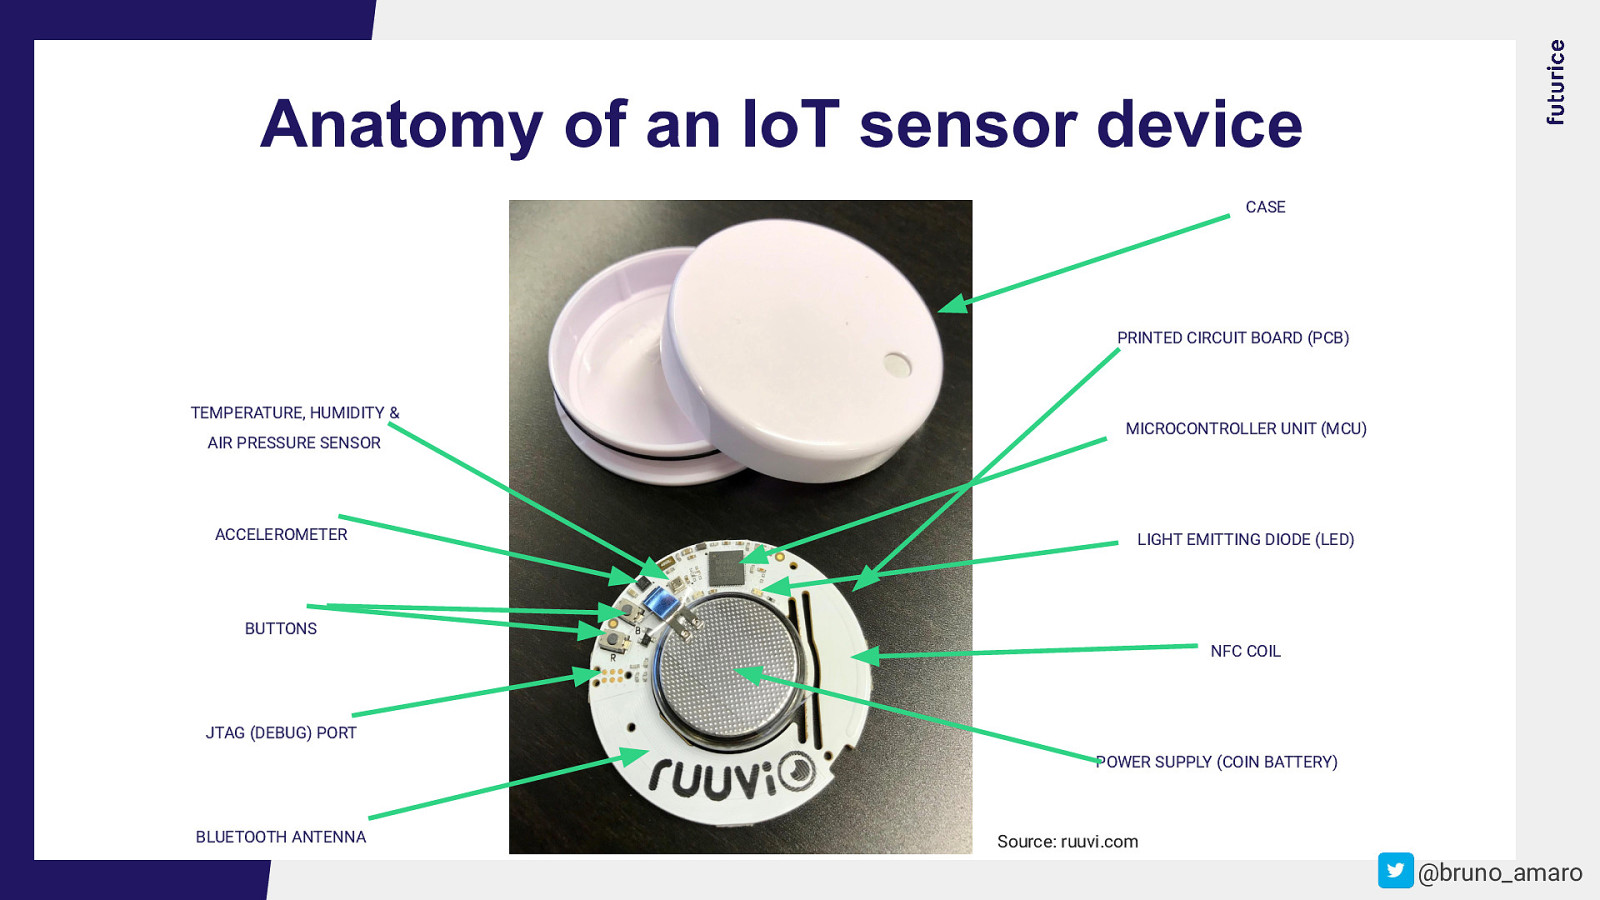
Anatomy of an IoT sensor device CASE PRINTED CIRCUIT BOARD (PCB) TEMPERATURE, HUMIDITY & AIR PRESSURE SENSOR ACCELEROMETER MICROCONTROLLER UNIT (MCU) LIGHT EMITTING DIODE (LED) BUTTONS NFC COIL JTAG (DEBUG) PORT POWER SUPPLY (COIN BATTERY) BLUETOOTH ANTENNA Source: ruuvi.com @bruno_amaro
Slide 19
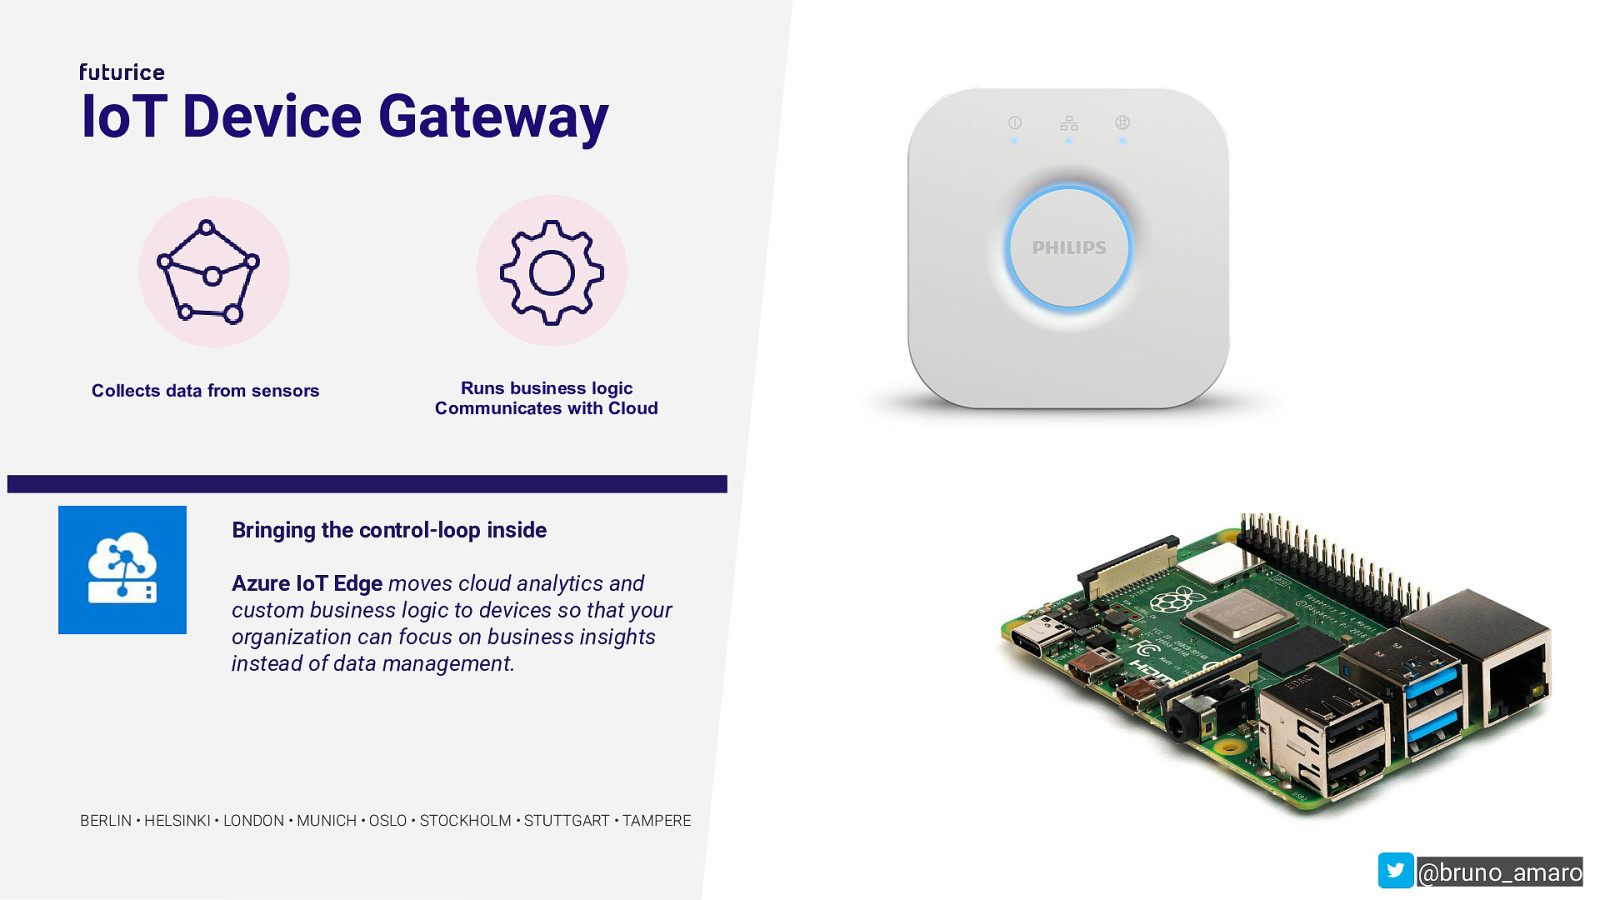
IoT Device Gateway Collects data from sensors Runs business logic Communicates with Cloud Bringing the control-loop inside Azure IoT Edge moves cloud analytics and custom business logic to devices so that your organization can focus on business insights instead of data management. BERLIN • HELSINKI • LONDON • MUNICH • OSLO • STOCKHOLM • STUTTGART • TAMPERE @bruno_amaro
Slide 20
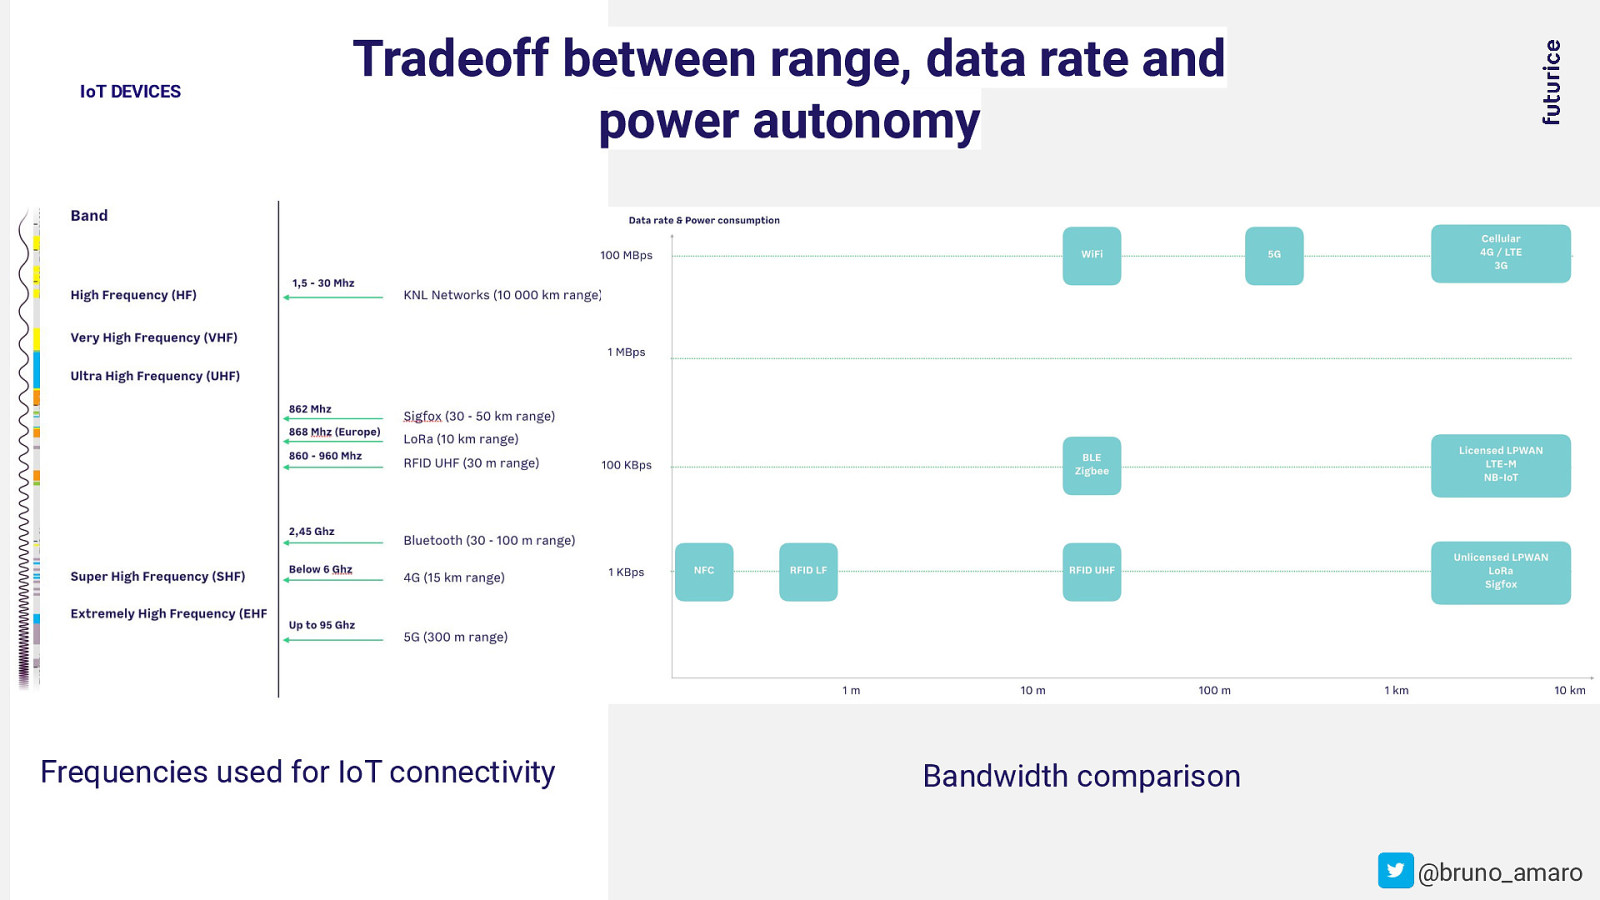
IoT DEVICES Tradeoff between range, data rate and power autonomy Frequencies used for IoT connectivity Bandwidth comparison @bruno_amaro
Slide 21
- Data Ingestion Photo by You X Ventures on Unsplash @samanax
Slide 22
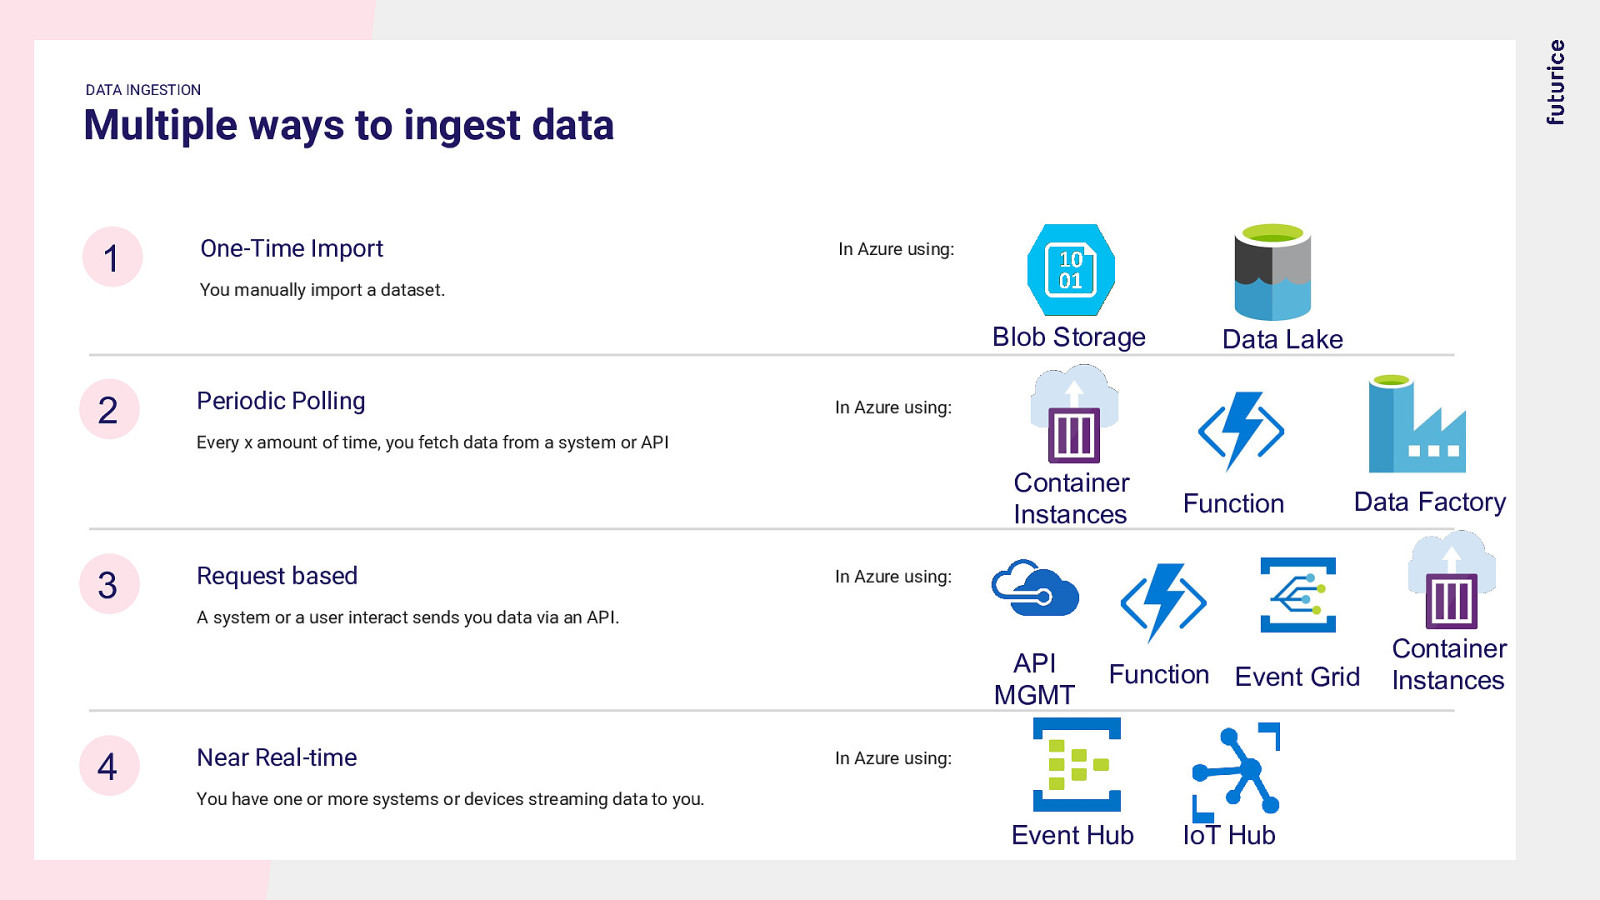
DATA INGESTION Multiple ways to ingest data 1 One-Time Import In Azure using: You manually import a dataset. Blob Storage 2 Periodic Polling Data Lake In Azure using: Every x amount of time, you fetch data from a system or API Container Instances 3 Request based Function Data Factory In Azure using: A system or a user interact sends you data via an API. API MGMT 4 Near Real-time Function Event Grid In Azure using: You have one or more systems or devices streaming data to you. Event Hub IoT Hub Container Instances
Slide 23
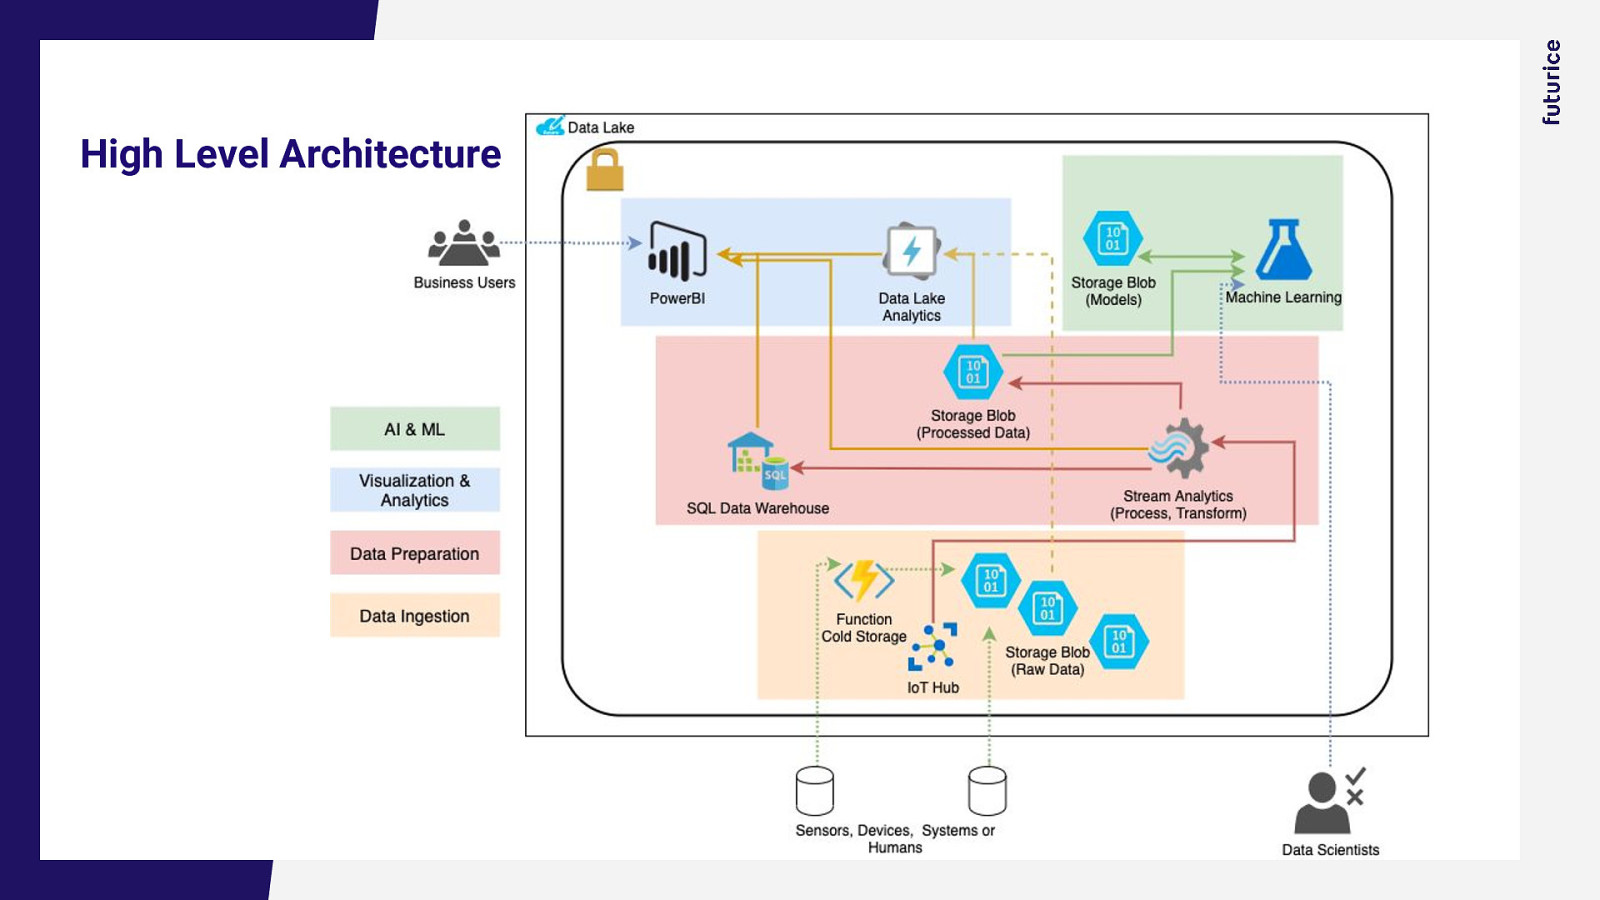
High Level Architecture
Slide 24
Azure RM Azure DevOps Terraform Photo by Dmitrii Vaccinium on Unsplash
Slide 25
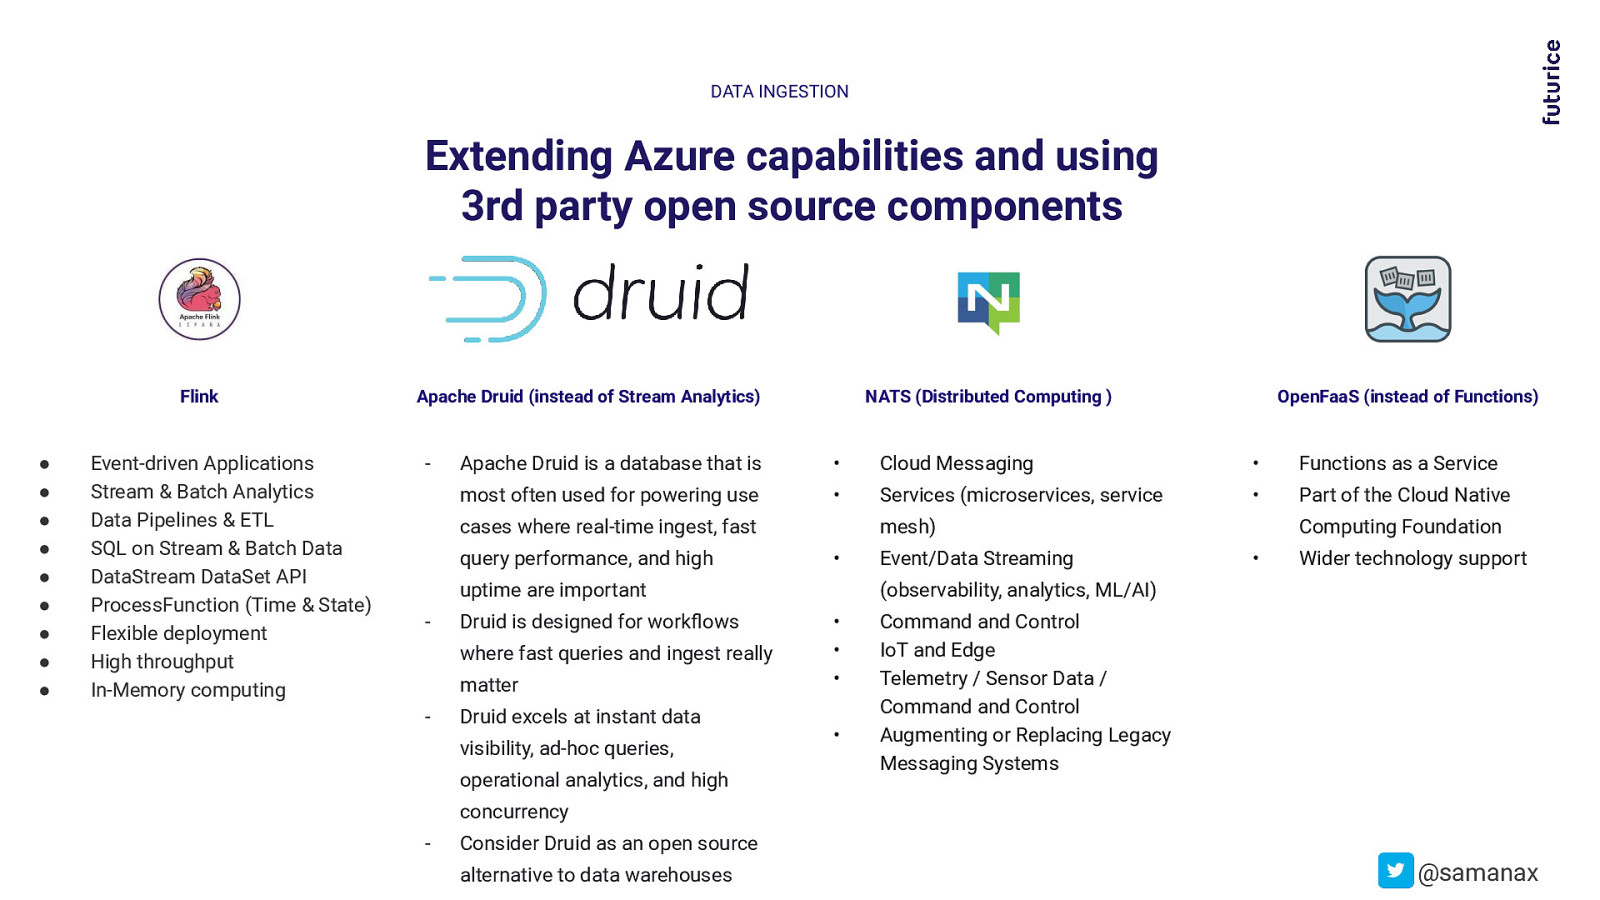
DATA INGESTION Extending Azure capabilities and using 3rd party open source components Flink ● ● ● ● ● ● ● ● ● Event-driven Applications Stream & Batch Analytics Data Pipelines & ETL SQL on Stream & Batch Data DataStream DataSet API ProcessFunction (Time & State) Flexible deployment High throughput In-Memory computing Apache Druid (instead of Stream Analytics)
NATS (Distributed Computing ) Apache Druid is a database that is • Cloud Messaging • Functions as a Service most often used for powering use • Services (microservices, service • Part of the Cloud Native query performance, and high • where fast queries and ingest really matter - Druid excels at instant data visibility, ad-hoc queries, operational analytics, and high Event/Data Streaming • Wider technology support (observability, analytics, ML/AI) uptime are important Druid is designed for workflows Computing Foundation mesh) cases where real-time ingest, fast
OpenFaaS (instead of Functions) • • • • Command and Control IoT and Edge Telemetry / Sensor Data / Command and Control Augmenting or Replacing Legacy Messaging Systems concurrency - Consider Druid as an open source alternative to data warehouses @samanax
Slide 26
- Data Preparation Photo by Maarten van den Heuvel on Unsplash @samanax
Slide 27
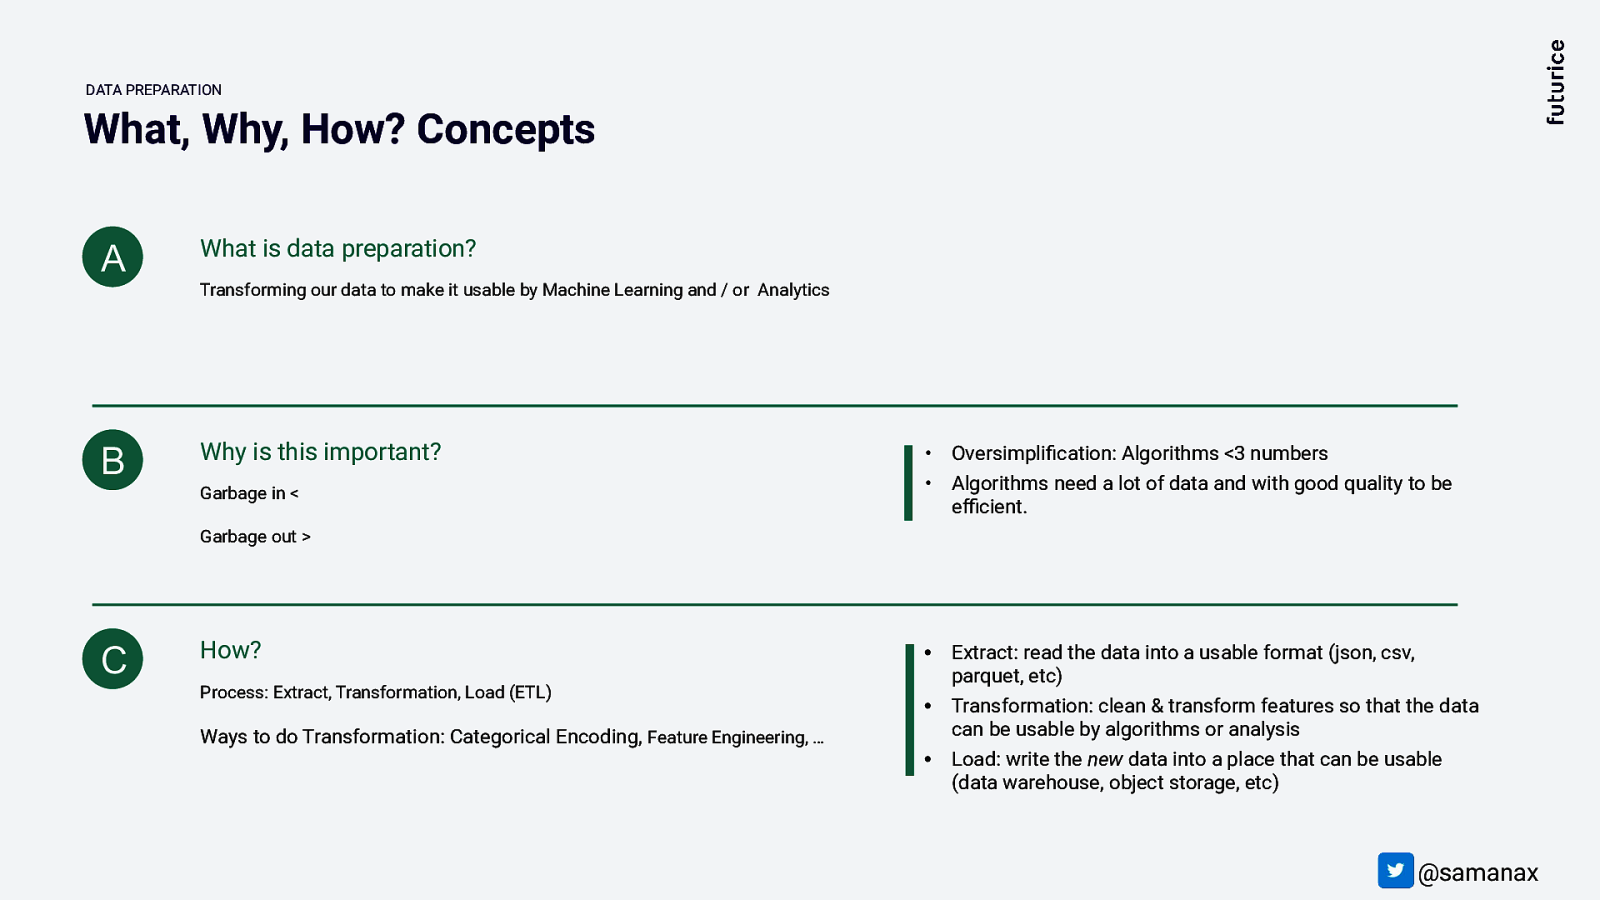
DATA PREPARATION What, Why, How? Concepts A What is data preparation? Transforming our data to make it usable by Machine Learning and / or Analytics B Why is this important? • Oversimplification: Algorithms <3 numbers Garbage in < • Algorithms need a lot of data and with good quality to be efficient. • Extract: read the data into a usable format (json, csv, parquet, etc) Transformation: clean & transform features so that the data can be usable by algorithms or analysis Load: write the new data into a place that can be usable (data warehouse, object storage, etc) Garbage out > C How? Process: Extract, Transformation, Load (ETL) • Ways to do Transformation: Categorical Encoding, Feature Engineering, … • @samanax
Slide 28
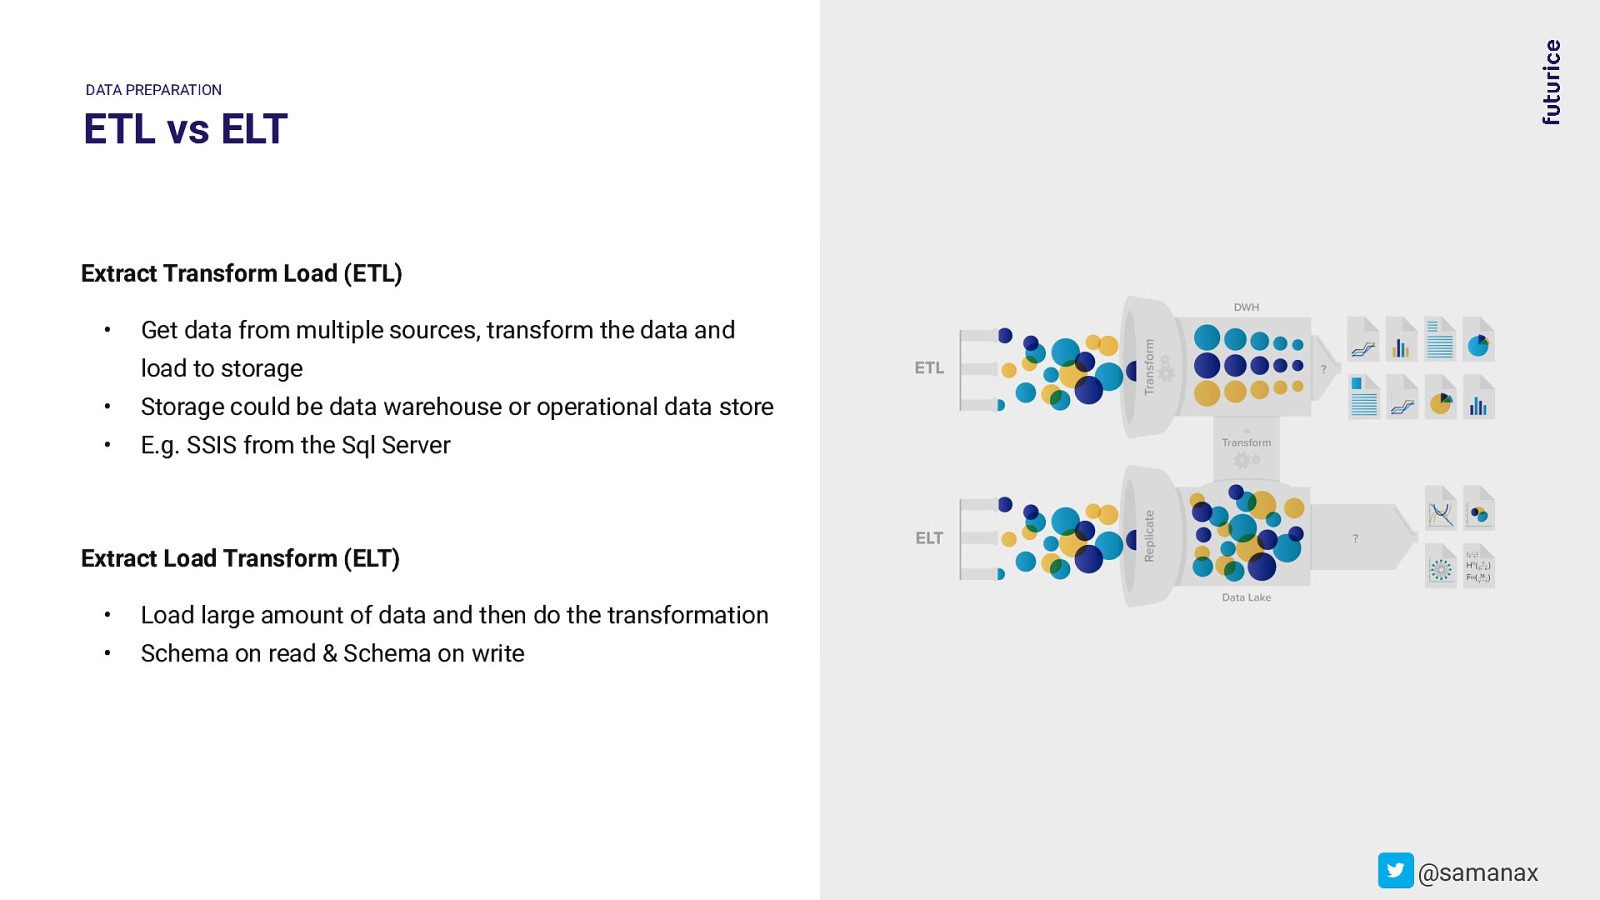
DATA PREPARATION ETL vs ELT Extract Transform Load (ETL) • Get data from multiple sources, transform the data and load to storage • Storage could be data warehouse or operational data store • E.g. SSIS from the Sql Server Extract Load Transform (ELT) • Load large amount of data and then do the transformation • Schema on read & Schema on write @samanax
Slide 29
- AI, Visualization & Analytics Photo by Carlos Muza on Unsplash @bruno_amaro
Slide 30
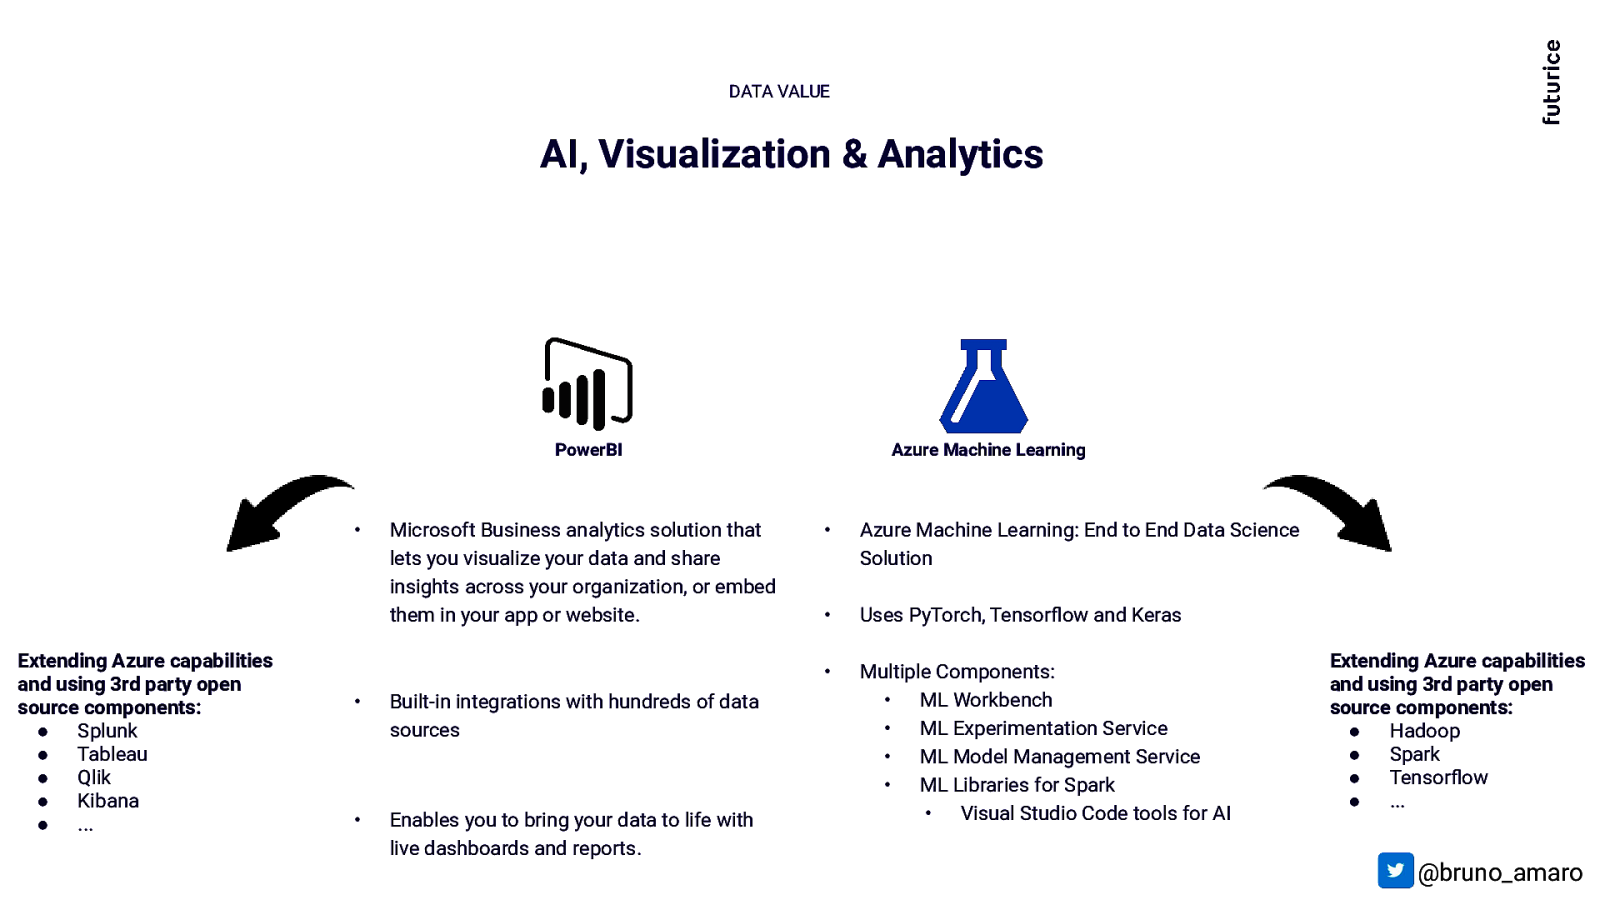
DATA VALUE AI, Visualization & Analytics PowerBI • Extending Azure capabilities and using 3rd party open source components: ● Splunk ● Tableau ● Qlik ● Kibana ● … Microsoft Business analytics solution that lets you visualize your data and share insights across your organization, or embed them in your app or website. • Built-in integrations with hundreds of data sources • Enables you to bring your data to life with live dashboards and reports. Azure Machine Learning • Azure Machine Learning: End to End Data Science Solution • Uses PyTorch, Tensorflow and Keras • Multiple Components: • ML Workbench • ML Experimentation Service • ML Model Management Service • ML Libraries for Spark • Visual Studio Code tools for AI Extending Azure capabilities and using 3rd party open source components: ● Hadoop ● Spark ● Tensorflow ● … @bruno_amaro
Slide 31

High Level Architecture
Slide 32

How hard can it be? @samanax Photo by Clarisse Croset on Unsplash @bruno_amaro
Slide 33
Thank you! Kiitos! Danke! Tack! Saman Ahmadi PRINCIPAL ARCHITECT & ADVISOR Reach out on: BERLIN • HELSINKI • LONDON • MUNICH • OSLO • STOCKHOLM • STUTTGART • TAMPERE Bruno Amaro Almeida PRINCIPAL ARCHITECT & ADVISOR Reach out on: @samanax @bruno_amaro @samana @brunoamaroalmeida
Slide 34
Co-creating a resilient future